

Capital Flows to Where It’s Treated Best

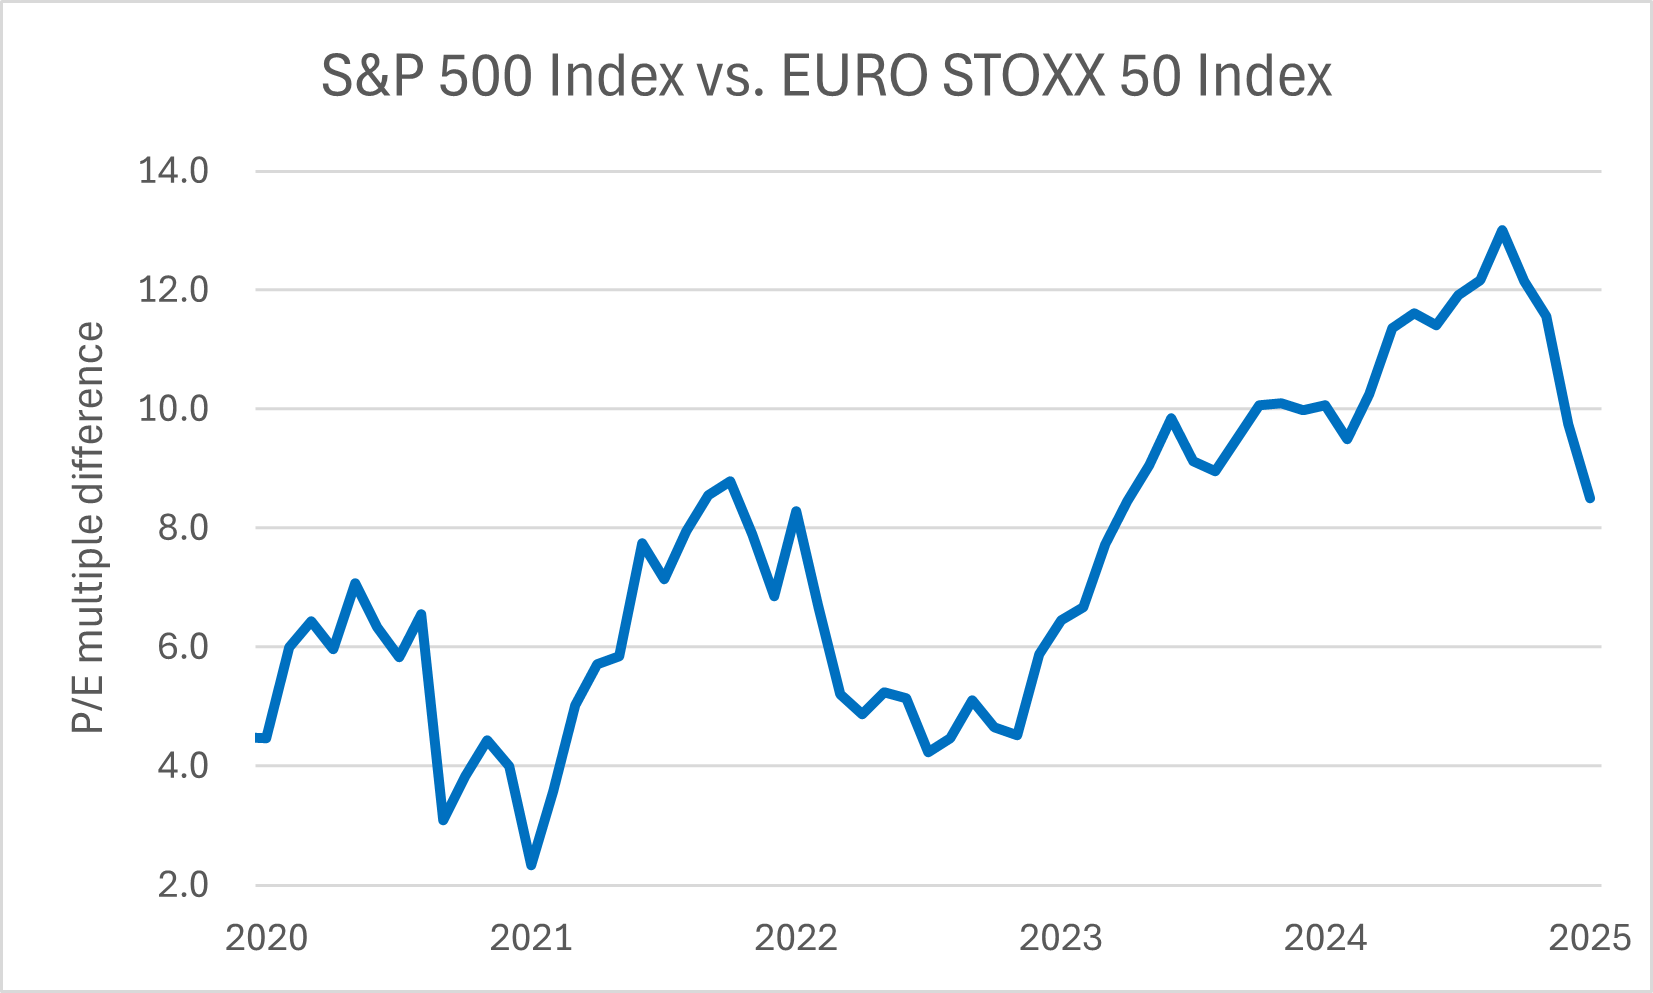
The U.S./European P/E multiple spread peaked in late 2024.
It has rapidly dropped back toward the five-year average.
The change should increase the appeal of U.S. stocks.
Your money doesn’t care about politics… it tends to go where it can grow!
In 2005 I was still cutting my teeth on Wall Street. At the time, I lived in New York. The experience was great because it gave me easy access to my clients. In other words, I could get out to visit them during nonwork hours when they had more time to relax. As a result, we were able to get to know each other better and have deeper conversations about the markets, investing, and how I could help them.
The firm I worked for only dealt in U.S.-based investments. It was especially known for its research in the technology and financial sectors. Now that’s helpful when everyone wants to buy the shares of domestic companies. But, if client assets are chasing better returns in other parts of the world, U.S. focused research would become less relevant.
My best client at the time was a value-based global hedge fund. That meant they were always interested in dating and not marriage. In other words, they would invest in ideas where they saw the best short-term profit potential rather than hanging onto a company’s shares for the long term. As a result, their positions and interests were constantly changing.
One morning he called me up to let me know they were shifting gears in the near term. He said they saw more value abroad than in the U.S. He said that until the price-to-earnings (“P/E”) multiple on U.S. stocks looked increasingly attractive, his firm would be investing more of its assets in Europe. And as the next chart shows, in late 2004, the U.S. was more expensive than Europe.
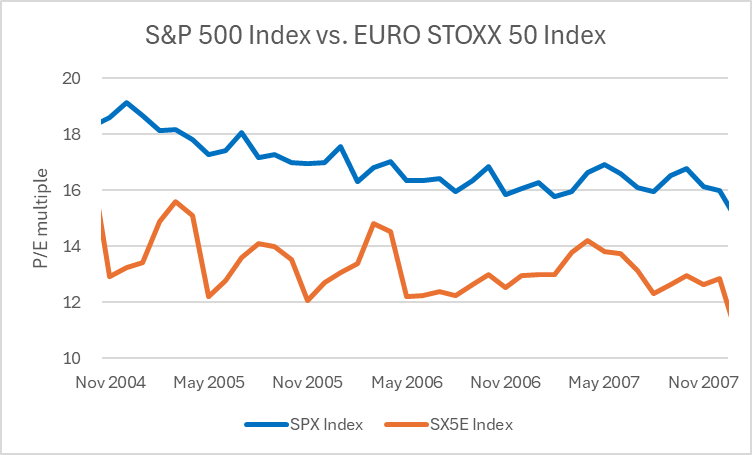
This dynamic reminds me very much of the current scenario. Since late 2022, overseas investors had been investing more money in the U.S. But, coming into the end of 2024, European stocks looked increasingly compelling to U.S. stacks on a P/E multiple basis. That meant money was exiting out markets in favor of the potential for more upside abroad. And now, with the prospect of rising tariffs, those investors have felt more compelled to return funds to their home markets. Yet eventually, as U.S. valuations become increasingly attractive, those assets will find their way back. And that should lead to steady long-term gains for the S&P 500.
But don’t take my word for it, let’s look at what the data’s telling us…
In 2024, the U.S. stock market saw a record amount of investment into stocks via exchange traded funds (“ETF). According to State Street Global, almost $1.1 trillion was invested in domestic ETFS. Meanwhile, the European equivalent gathered just $12.9 billion in new assets. Clearly a wide margin of difference.
But as all of that money was going into passively managed funds, it was driving up the multiple of U.S. stocks and indexes. As you can see in the following chart, since the start of 2023, the difference in P/E multiple between the S&P 500 and EURO STOXX 50, began to widen…
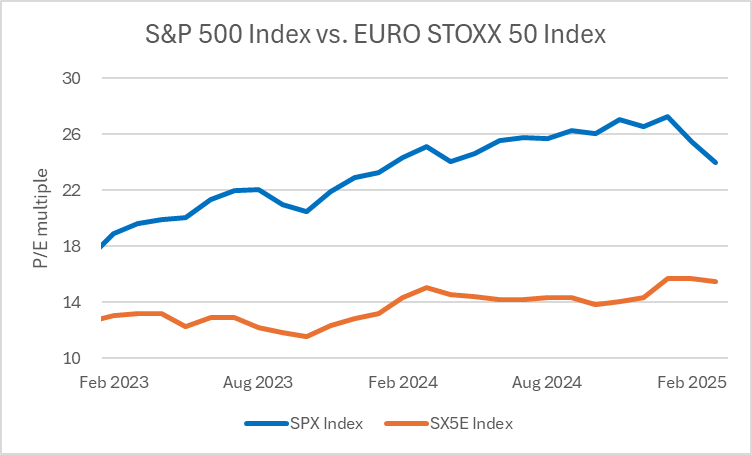
By the start of 2025, the S&P 500’s multiple rose to 26.5 times reported numbers while the EURO STOXX 50’s was just 14.4 times. That would prove to be the largest multiple gap we’ve seen going back to the start of 2004…
Thought of another way, based on the reported assets flows, everyone was piled into U.S. based stocks, while there was relatively low exposure to European assets.
So, by the end of January 2025, money began flowing back into European funds. According to financial data provider Morningstar, European ETFs have garnered almost $19 billion in new assets so far this year. Meanwhile their U.S. counterparts have amassed roughly $5 billion year to date, which includes an exit of roughly $4 billion over the last few weeks.
As a result, we’re starting to see the difference in P/E multiple compress once more. Because, as money comes out of U.S. stocks, it drives the multiple down. Meanwhile, funds flowing into European stocks drive that multiple back up. Currently, the difference in the spread is 8.5 percentage points. That’s just above the five-year average of 7.6. That means U.S. stocks are becoming more appealing to investors.
So, despite all the turmoil due to the on-again, off-again nature of tariff policies, we’ve seen these types of scenarios before. Investors are putting their money to work in other markets where they see more upside potential. But, based on the recently toned-down rhetoric from the White House, Wall Street’s economic growth warning appears to be getting through. And as the administration takes steps to boost investor confidence, the relative value of U.S. stocks should be increasingly attractive. The change should lead to a long-term steady rally in the S&P 500.
Five Stories Moving the Market:
Bank of Japan Governor Kazuo Ueda said the central bank may need to take policy action if U.S. tariffs hurt the Japanese economy; he stated that since February, risks surrounding White House policies have "moved closer towards the bad scenario" the BOJ had envisioned – Reuters. (Why you should care – the commentary leans in the direction of easing monetary policy once more)
Nvidia said the U.S. government will begin requiring a license to export the company’s H20 chips to China, an escalation of restrictions that the company has publicly opposed – Bloomberg. (Why you should care – the change doesn’t stop chip sales but means the U.S. government will have tighter control over sales to China)
The White House’s new tariffs could cost U.S. semiconductor equipment makers more than $1 billion a year, according to industry calculations discussed with officials and lawmakers in Washington last week – Reuters. (Why you should care – quantifying losses should help analysts determine fair-value prices for companies like Applied Materials, Lam Research, and KLA)
Prices of imports into the U.S. fell back a month before President Trump’s package of sweeping tariffs came into effect; import prices were 0.1% lower on month in March, marking the first time since September that imports have cost less from one month to the next – WSJ. (Why you should care – lower fuel prices more than offset increase for goods prices)
The European Union and U.S. made scant progress bridging trade differences this week as officials from President Donald Trump’s administration indicated that the bulk of the U.S. tariffs imposed on the bloc will not be removed, according to sources – Bloomberg. (Why you should care – the chief trade negotiator for the U.S., Scott Bessent, has been in Argentina)
Economic Calendar:
China – GDP for 1Q
China – Industrial Production, Retail Sales for March
U.K. – CPI for March (2 a.m.)
U.S. - MBA Mortgage Applications (7 a.m.)
U.S. – Retail Sales for March (8:30 a.m.)
U.S. – Industrial Production, Capacity Utilization for March (9:15 a.m.)
Bank of Canada Monetary Policy Announcement (9:45 a.m.)
U.S. – NAHB Housing Market Index for April (10 a.m.)
U.S. - Energy Information Administration Crude Oil Inventory Data (10:30 a.m.)
BOC’s Macklem (President) Speaks (10:30 a.m.)
Treasury Auctions $13 Billion in 20-Year Bonds (1 p.m.)
Fed’s Powell Speaks (1:15 p.m.)
Fed’s Schmid (Kansas City) Speaks (7 p.m.)