


Prepare for Annualized CPI Growth to Ease in January

The Cleveland Fed is predicting CPI rose 0.2% in January.
That means the pace of annualized growth could fall to 2.5%.
That will boost the outlook for rate cuts later this year.
The stock and bond markets are about to face their next big inflation test…
This week brings another important update on price pressures. On Wednesday, the U.S. Bureau of Labor Statistics (“BLS”) is set to release its consumer price index data (“CPI”) for January. The number is important because it’s an indicator of the current potential for intertest rate cuts by the Federal Reserve.
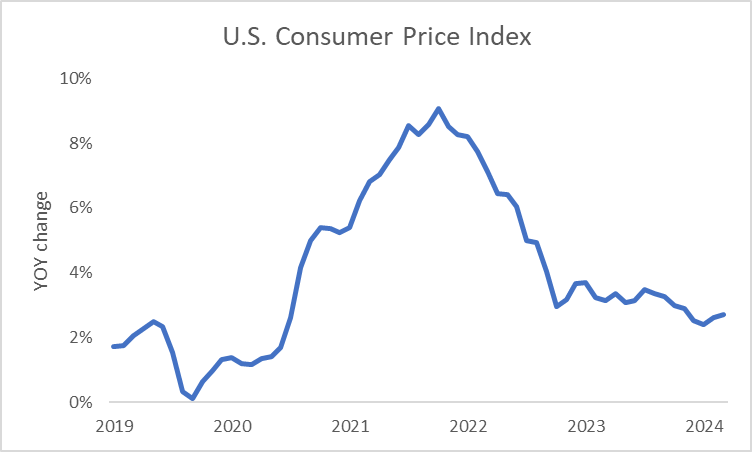
Over the last few months, CPI inflation growth has been on the rebound. After hitting a cycle low of 2.4% in September, the 12-month total shot all the way back up to 2.9% in December. The shift stoked concerns about the need for our central bank to start tightening policy once more.
According to the data I look at, CPI rebounded in January compared to no change in December. Confirming that expectation is the Federal Reserve Bank of Cleveland’s Inflation Nowcast estimate. The regional central bank’s staff predicted a month-over-month change of 0.2%.
Now, while that type of data may at first seem concerning, it shouldn’t be. Because, if that winds up being the outcome for January, it will mean the pace of annualized growth is slowing. That will signal to the central bank that its current policy is working, increasing the potential for rate cuts later this year. That would go against the naysayers calling for rate hikes later this year. The change will underpin a steady rally in the S&P 500 Index.
But don’t take my word for it, let’s look at what the data’s telling us…
Each month, a number of regional Fed banks reach out to manufacturing and services companies in their districts. They ask those businesses about the level of activity they’re seeing. They want to gauge whether commerce has improved, worsened, or stayed the same.
I like to follow the results from the Dallas, Kansas City, New York, and Philadelphia Fed banks. Those four districts combine for about 25% of national gross domestic product. By looking at the results we can get a sense of what’s transpiring nationally. In addition, the data comes out just before the end of each month, so it’s like having an early look into what might unfold when entities like the BLS release market-moving data.
Today, we’re focusing on the results of the prices received index. The reading measures what those manufacturing and services companies’ customers are willing to pay for the goods or services they’re buying. So, it’s akin to CPI.
In the following chart, you’ll see the prices received gauge is a leading indicator of inflation. Back in April 2020, the measure hit the cycle low just ahead of CPI. Then in November 2021, the gauge peaked about seven months prior to national prices. Ever since, our manufacturing index has been headed lower.
As you’ll notice on the right side of our graph, prices received have been stabilizing. The trend began in July 2023 and has been holding steady. Yet, after dropping in December, we experienced a slight rebound in January.
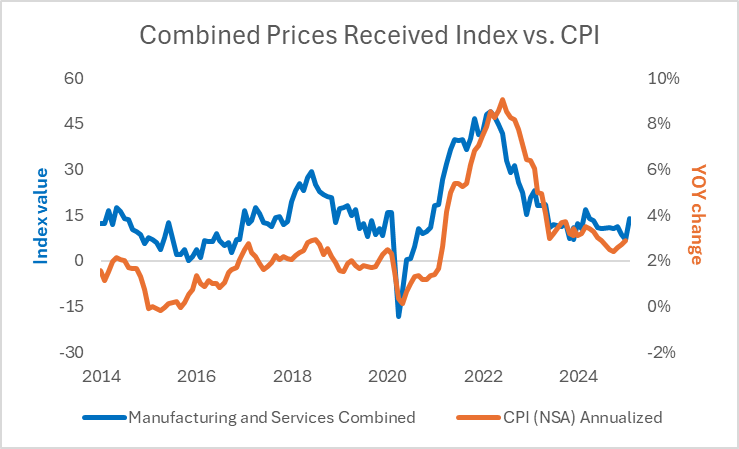
For this gauge, I combined both the services and manufacturing results to give us a complete picture. I tried to give the two indexes a weighting similar to what each would receive from the BLS. I weighted services as 65% of the average and goods at 35%.
According to my results, the combined prices received number rose to the levels seen in October. That was the last time we experienced an increase in non-seasonally adjusted month-over-month inflation growth. At the time, the gauge increased 0.1%.
Now, as I mentioned at the start, the Cleveland Fed is calling for a gain of 0.2%. We must remember that annualized numbers are a sum total of the data for the last 12 months. And, as I’ve been saying, the four hottest months of last year were January through April. They accounted for 2.1% of the 2.9% total. Take a look at this table of the last 12 months to see what I mean…
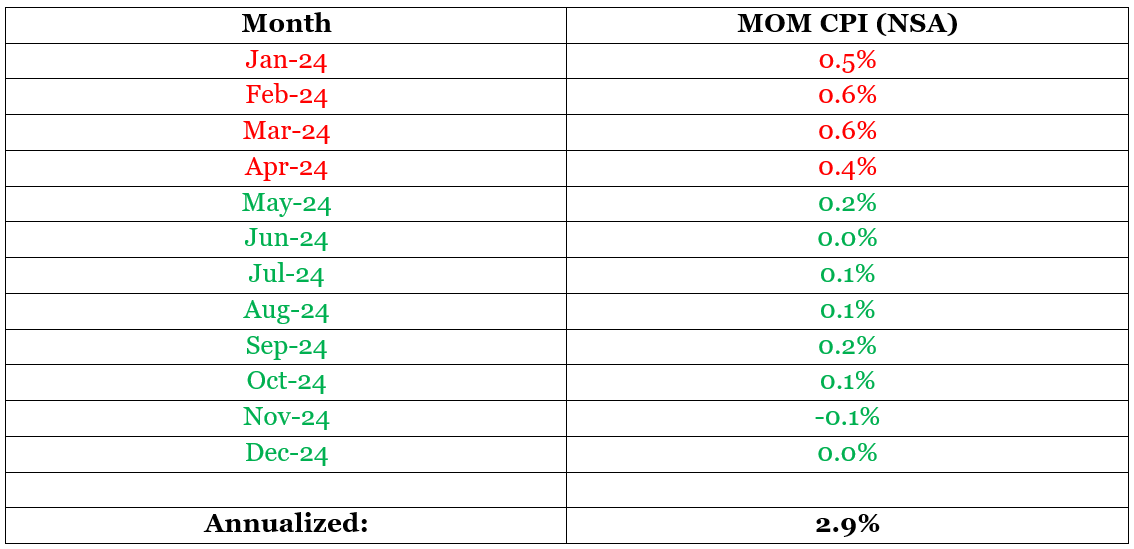
If that proves to be the case, it will mean we’re trading a hot number from last year for a much lower number to star this year. Due to rounding, the annualized pace of headline CPI will drop from 2.9% to 2.5%. In addition, the forward-looking six-month average rate of growth for CPI is 0.09%. If we annualize that out over 12 months, that gets us to a 1.1% rate of annual growth.
We care because that type of growth is far below current levels and the central bank’s 2% target. That’s a huge deal for the monetary policy outlook. Currently, Wall Street is only pricing in two rate cuts next year. If inflation growth starts to plummet, that outlook should change in a hurry. Because the gap between price growth and borrowing costs would expand rapidly. That would mean a larger cushion for rate cuts.
As I showed you above, at the start of 2024, inflation growth ran hot. That means the annualized number could appear high for a few more months. But as we move forward in 2025, we’ll start to lose the highest inflation readings. In fact, if the current pace of growth holds, we could see annualized numbers hit 2% with the release of February data next month.
So, instead of being caught up in the here and now, look ahead to where the conversation is going. Because the outlook should point to stable economic growth, underpinning a steady rally in the S&P 500.
Five Stories Moving the Market:
China’s consumer inflation accelerated in January as food and service prices climbed ahead of the Lunar New Year holiday; the consumer-price index rose 0.5% from a year earlier in January, up from 0.1% in December, the National Bureau of Statistics said – WSJ. (Why you should care – while the data point to a rebound in inflation growth it still signals moderation in economic growth)
President Donald Trump said he would hold a news conference on Tuesday or Wednesday to provide detailed information on his reciprocal tariff plan; he said the U.S. would match tariff rates levied by other countries and that this would apply to all countries – Reuters. (Why you should care – White House officials said it’s trying to level the playing field, especially with countries that subsidize industries)
The EU will offer to cut tariffs on U.S. car imports as part of a deal to avoid a trade war with Donald Trump; Bernd Lange, who heads the European parliament’s trade committee, told the Financial Times the bloc was willing to lower its 10 per cent import tax closer to the 2.5 per cent charged by the U.S. – FT. (Why you should care – such an outcome could boost demand for domestically made goods abroad)
U.S. Senate Republicans released a budget plan that would increase spending by $85 billion a year over four years for a total of about $340 billion, a sum that would be offset through spending cuts; Republicans in the House of Representatives are working on their own budget plan, hoping to begin marking it up in the coming week – Reuters. (Why you should care – the different approaches signal concern around deficit spending, potentially weighing on 10-year U.S. Treasury yields)
Disney insiders worry that the company has become addicted to price hikes and has reached the limits of what middle-class Americans can afford; internal discussions over whether Disney parks may be losing their grip on the hearts and wallets of families with young kids have become more frequent – WSJ. (Why you should care – 74% of respondents in a WSJ poll found that experiential vacations are becoming unaffordable for most Americans)
Economic Calendar:
Earnings – MCD, ON, VRTX
China – CPI, PPI for January
China – New Loans for January
Japan – Bank Lending for January
Eurozone – Sentix Investor Confidence for February (4:30 a.m.)
ECB’s Lagarde (President) Speaks (9 a.m.)
Treasury Auctions $84 Billion in 13-Week Bills (11:30 a.m.)
Treasury Auctions $72 Billion in 26-Week Bills (11:30 a.m.)
Treasury Auctions $58 Billion in 3-Year Notes (1 p.m.)