Inflation Data Signals Rapid Deceleration, Supporting Small Cap Stock Rally
Annualized CPI growth hit 2.7% in November.
The forward-looking six-month average showed annualized growth of 0.9%.
The data point to plenty of cushion for Fed rate cuts next year.
Invest for what the economy looks like in 10 to 12 months, not right now…
During my career on Wall Street, I came across all sorts of people. Each of them had different qualities that made them great. Some had a knack for getting along well with others… some were good at finding misunderstood stocks where a quick profit could be had… some could tell an incredible story… and others were great at managing risk. But the people I really respected were those who could see the road ahead long before others.
One such person was a former client of mine, Ken Brodkowicz. He started out as a salesperson at Goldman Sachs. Eventually, he left to work as a hedge-fund portfolio manager. But after having built a great track record, he realized he could enjoy more success being on his own. And sure enough, that’s exactly what happened. Within several years, his performance took off and investors were seeking him out.
The thing I respected the most was Ken’s ability to weed out the signal from the noise. He had a knack of looking through all the chaos surrounding him and identifying an opportunity. I enjoyed our discussions because of his feedback and how I typically came away learning something. But the one thing he always reminded me of… invest for where the story is headed, not where it is.
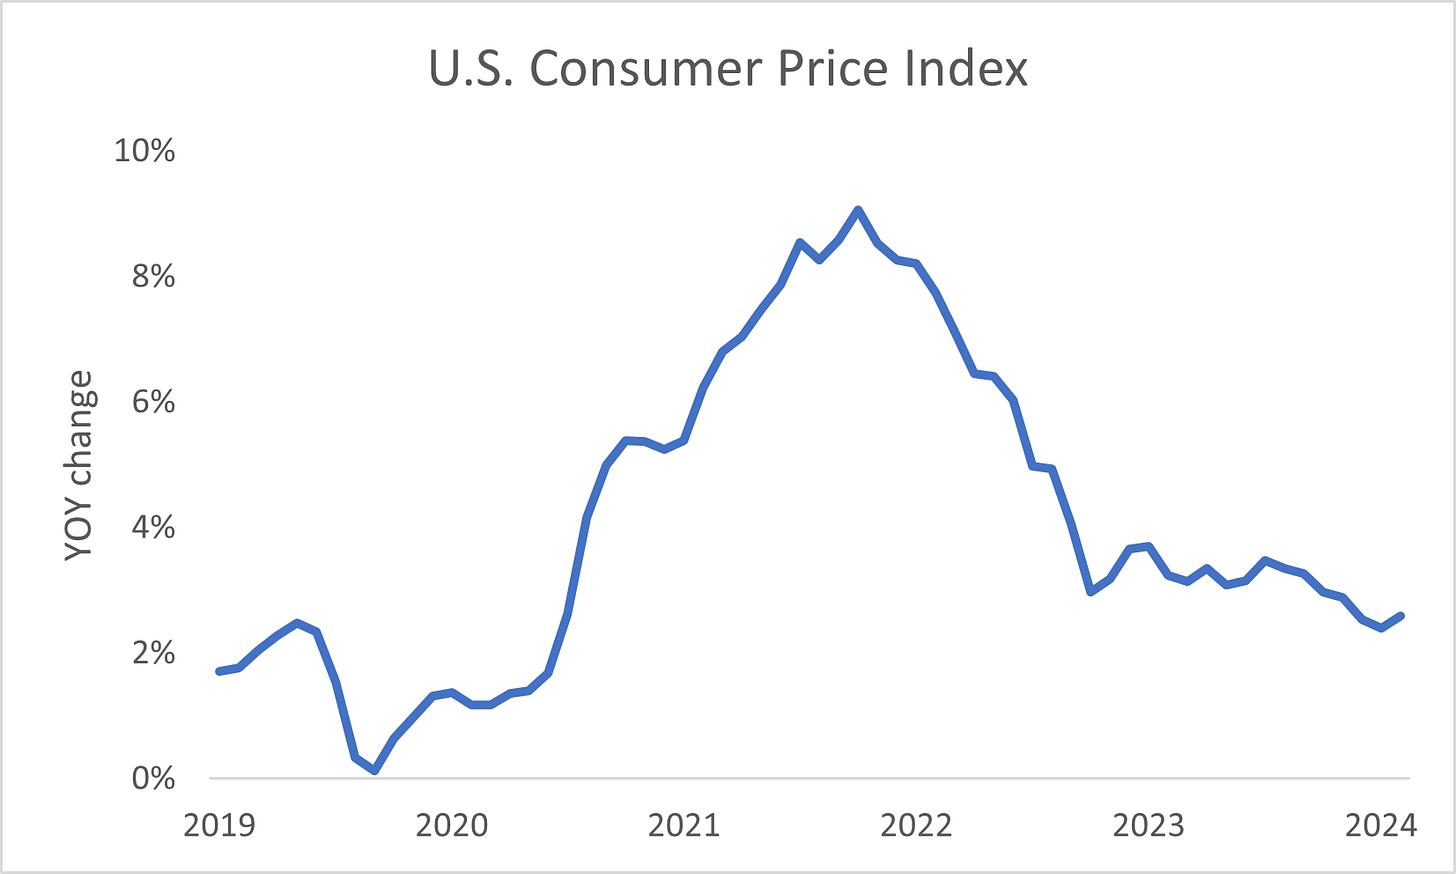
Yesterday made me think of those conversations. The U.S. Bureau of Labor Statistics (“BLS”) reported annualized inflation growth rose to 2.7% in November compared to the 2.6% pace reported in October…
The headlines had the media worked up about the damage our central bank is doing by lowering rates. The Wall Street Journal ran a headline saying, “Growing Inflation Poses Challenge for Trump, Fed,” and CNBC’s Rick Santelli said he couldn’t understand why the stock market was rising on the heels of the release.
Well, those outlets are looking at where the conversation is and not where it’s headed. As I highlighted on Monday, the forward-looking inflation metrics will show easing growth… and that’s exactly what happened. Monthly numbers contracted 0.1% on a non-seasonally adjusted basis. The change supports central bank rate cuts moving forward and a steady rally in the interest-rate sensitive Russell 2000 Index.
But don’t take my word for it, let’s look at what the data’s telling us…
If we want to consider how to invest for what the future of monetary policy looks like, we have to consider the picture from the Federal Reserve’s point of view. Right now, policymakers are focused on what the labor market and inflation pictures look like when it comes to deciding on the path of borrowing costs. Our central bank is looking to return the pace of hiring and price pressure growth back to pre-pandemic levels. Once it has achieved those goals, it should be able to take similar action with rates.
Last week, we received another sign that employment growth is back to 2017-2019 levels. November nonfarm payrolls showed the average rate of monthly hiring for 2024 is 180,000 compared to the 177,300 average from 2017-2019. Since that goal appears to have been accomplished, we want to see indicators that price pressures are back below the Fed’s 2% target.
That’s exactly what we received yesterday…
The BLS releases its consumer price index in two forms… annualized and monthly. The annualized numbers give us an indicator of the picture for the past 12 months while the monthly data tell us about the current trend. But the measures are tabulated in two different ways. The annualized numbers are reported on a non-seasonally adjusted (raw numbers) basis while the monthly results are seasonally adjusted (take things like weather into account).
To track the annualized trends, I like to watch the non-seasonally adjusted numbers. Because, as the BLS puts it, “those are the prices consumers are actually paying.”
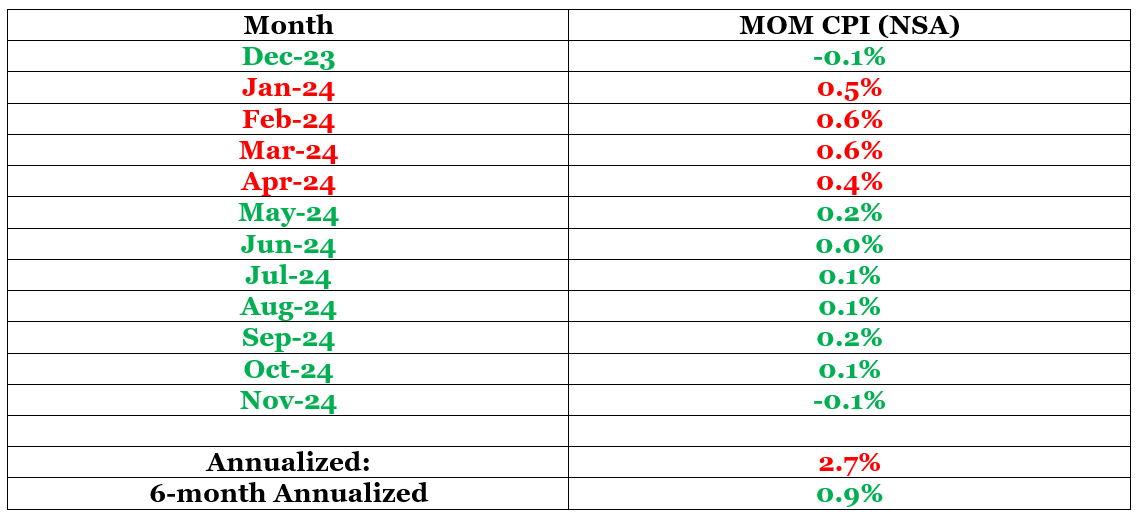
As I highlighted last month and earlier this week, there’s an important shift taking place. The weakest data from the end of last year is fading while we’re still hanging onto the highest numbers from the start of this year. January through April account for 2.1% of yesterday’s 2.7% annualized growth. But the six-month trend shows rapid improvement…
I highlighted the numbers in two colors. The red numbers are the high results pushing annualized price growth higher while the green numbers are weak ones, dragging the same headline result lower. As you’ll notice, the numbers at the top are mostly red while those at the bottom are all green. That’s telling us the growth trend is moving lower.
Fed officials like Chairman Jerome Powell and Richmond President Thomas Barkin have told us it’s looking through the dynamic and focused on the recent figures. They understand the high numbers will soon disappear. Based on the results from the last six months, the average pace of monthly inflation growth is 0.08%. That equates to an annualized number of 0.9%. That’s far below the 2.7% pace from the last 12 months.
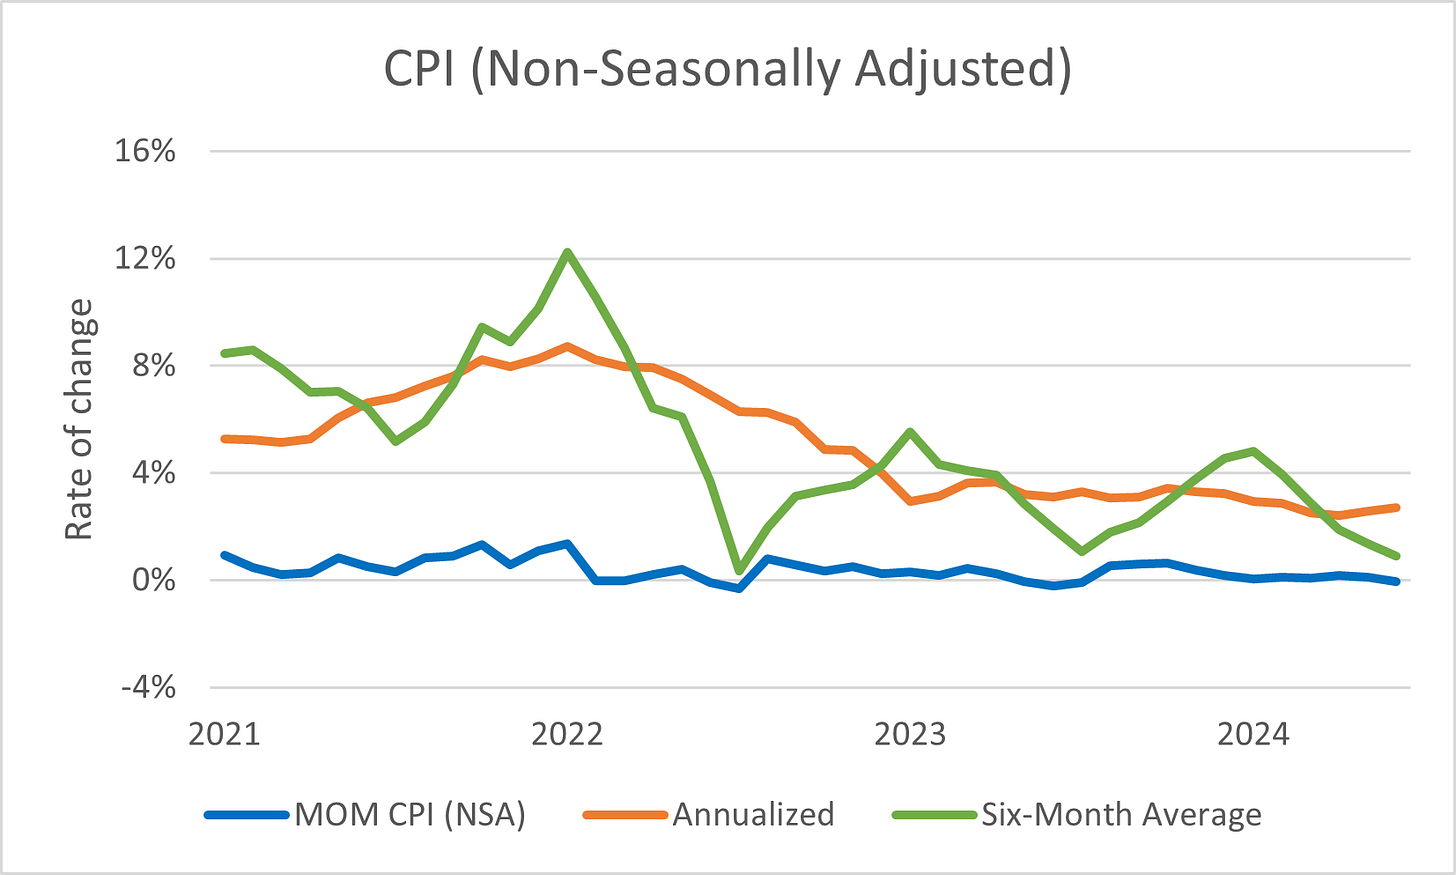
Now look at the annualized compared to the six-month average trends…
Notice the six-month average has been moving steadily lower over the last couple of years compared to the huge range in 2021 and 202. That’s indicating that price pressures are stabilizing. The implication of stable prices being inflation should become more predictable. That’s the scenario the Fed has been seeking to return borrowing costs back to neutral (neither hurts nor helps the economy).
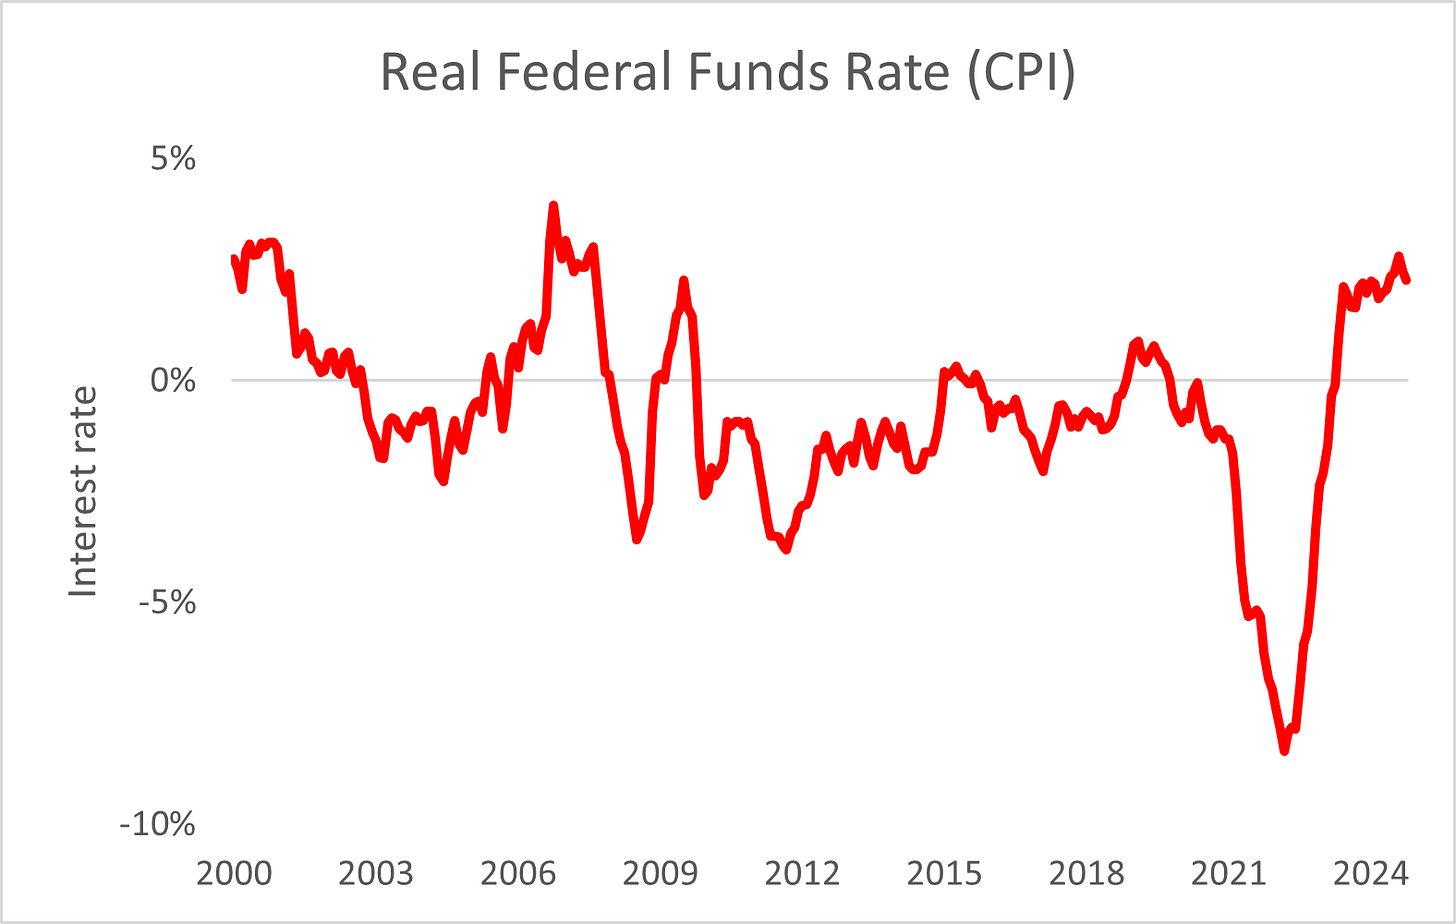
Now let’s look at where the real rate of interest stands…
The above chart measures the effective fed funds rate (cost for banks to borrow overnight) minus inflation. When it’s positive, rates weigh on prices, but when the result’s negative, rates boost prices. According to the November CPI number, the real rate of interest sits at 1.9%. In other words, the Fed could reduce interest rates by another 190 basis points before it hits neutral. For comparison purposes, the real rate averaged -0.3% between 2000 and 2020.
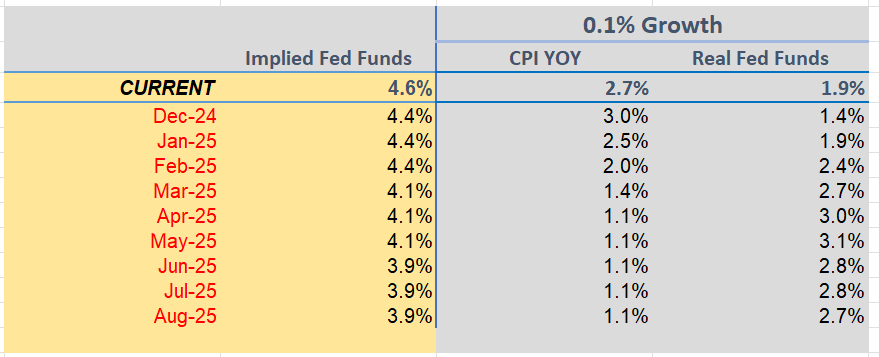
The last thing we want to observe is what inflation will look like moving forward and what that means for potential rate cuts…
In the above table, I calculated potential CPI growth based on the six-month average growth rate of 0.1%. According to my table, price pressures will fall below the Fed’s 2% target in March. Then by the end of the summer, annualized inflation could be all the way back to just 1.1%. If we price in the three rate cuts Wall Street predicts between now and then, our central bank will have room to lower rates by 270 basis points.
At the end of the day, the numbers are highlighting one consistent theme… economic activity (prices and employment) is returning to pre-pandemic levels. The only numbers that have yet to return to pre-pandemic levels are borrowing costs.
No matter what happens, there’s always going to be uncertainty. But, to ensure success, we must sort through all the noise and find the signal. And despite the people screaming about the Fed making a mistake and the need to rethink the path of interest rates, the data is telling a different story. Based on the numbers we just looked at, our central bank has a ton of room to keep cutting rates. That should underpin stable economic growth and a steady rally in risk assets like stocks.
Small cap stocks are on the verge of breaking out. The Russell 2000 is rapidly approaching new highs. Based on the past three times we’ve seen this scenario play out, the index has averaged a 40% rally over the following 21 months. And if the incoming administration of President-elect Trump can fulfill its campaign promises for boosting domestic growth, we should see small caps making new highs sooner than later.
If you’re interested in investing in this trend, look at small cap stocks. The Russell 2000 is rapidly approaching new highs. Based on the past three times we’ve seen this scenario play out, the index has averaged a 40% rally over the following 21 months. Consider the Vanguard Russell 2000 ETF (VTWO). It invests in Russell 2000 member companies, seeking to track the gauge’s returns. It trades about 1.7 million shares a day so it should be easy to buy and sell.
Five Stories Moving the Market:
The European Central Bank is all but certain to cut interest rates again today and signal further easing in 2025 as inflation in the eurozone is nearly back at its target and the economy is faltering – Reuters. (Why you should care – additional rate cuts by the ECB will provide room for the Federal Reserve to do more of the same)
Progress on bringing down inflation stalled in November, with the consumer-price index of goods and services costs ticking up to a 2.7% increase; prices of consumer goods—everything from cars to living-room furniture but excluding food and energy—increased at the fastest month-over-month pace in a year and a half – WSJ. (Why you should care – the forward-looking numbers point to a rapid deceleration in price growth)
The Bank of Canada cut its main interest rate by a half-percentage point, for the second meeting in a row, saying lower rates are needed to address weaker-than-expected growth and a softening labor market – WSJ. (Why you should care – a weakening Canadian economy is likely to sap demand for trade with its largest trading partner, the U.S.)
China's top leaders and policymakers are considering allowing the yuan to weaken in 2025 as they brace for higher U.S. trade tariffs as Donald Trump returns to the White House – Reuters. (Why you should care – Beijing would use such a measure to lower prices in an attempt to support its economy)
Apple is working with semiconductor company Broadcom on its first server chip designed to handle AI applications; the two companies are focused on the chip’s networking technology, which is critical for connecting a device to a network for AI processing – Tech Crunch. (Why you should care – increasing AI application offerings from Apple is likely to increase demand for the iPhone, boosting the revenue outlook)
Economic Calendar:
Swiss National Bank Policy Announcement (3:30 a.m.)
ECB Policy Announcement (8:15 a.m.)
U.S. - Initial Jobless Claims (8:30 a.m.)
U.S. - Continuing Claims (8:30 a.m.)
U.S. – PPI for November (8:30 a.m.)
ECB’s Lagarde Speaks (8:45 a.m.)
U.S. - Energy Information Administration Weekly Petroleum Inventories (10:30 a.m.)
Treasury Auctions $22 Billion in 30-Year Bonds (1 p.m.)
Fed's Balance Sheet Update (4:30 p.m.)


